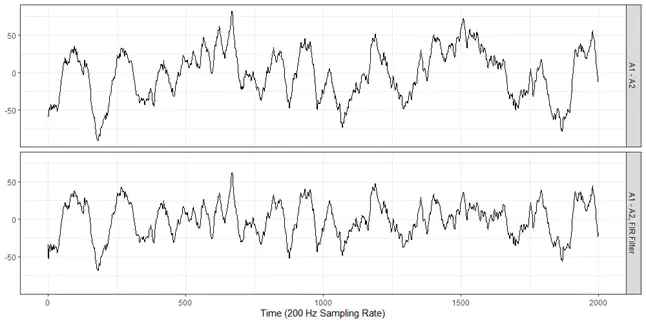
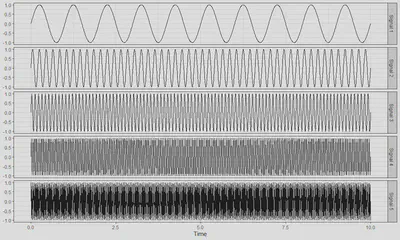
Above is a 10 second measurement from an A1-A2 electroencephalogram (EEG) lead, taken from a sleeping patient. We examine this data with a motivating example and application, using a Fast Fourier Transform (FFT), which is a computationally efficient and quick method to decompose sinusoidal signals into their component frequencies. We can show this using a series of signals at 1, 5, 10, 20 and 45 Hz shown below:
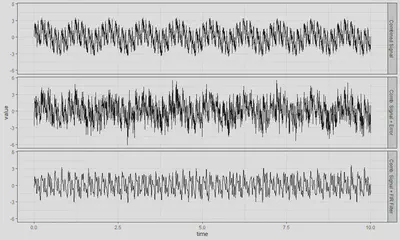
These 5 signals can be combined into a signal signal, with a gaussian random sample added to simulate noise. This combined signal can then be put through a finite impulse response (FIR) band-pass (3-30 Hz) filter to further reduce noise and target specific frequencies for signal decomposition.
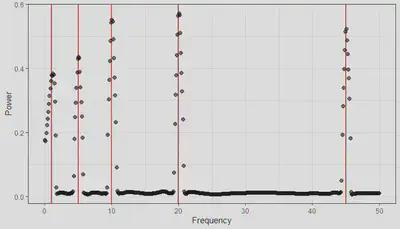
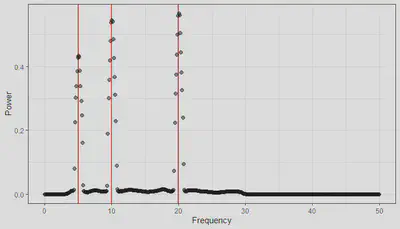
Using a multi-taper power spectral density method of estimation, we can show the original frequencies used to create the combined signal, both before and after a band-pass filter is applied.
We also apply multitaper PSD estimation to our EEG sample. In particular (because the patient was asleep) we focus on the lower frequencies (0.5 Hz - 40 Hz) as we expect there to be a large concentration of lower frequency brain waves.
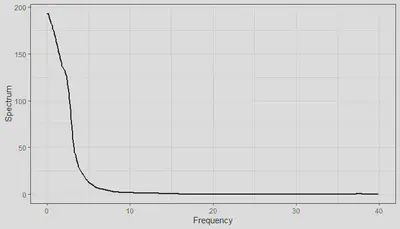
While this result may seem surprising at first, it does seem consistent with the data and highlights several features. Within EEG data, there are several defined frequency bandwidths which are associated with various states of consciousness. As this patient is asleep, we see high concentrations of Delta (0.5 - 4 Hz) and Theta (4 - 8 Hz) brain waves, with minimal higher brain waves. It also is visually consistent with the plotted EEG lead, as there are large sinusoidal waves in the reading.
Ian Arriaga-MacKenzie
Statistics and Computational Mathematics
My interests include optimization, algorithm design, and efficient experiment implementation.