Summary population allele data can be modeled using a binomial mixture distribtion with homogeneous reference populations. Here we show an example of this using the gnomAD V2.1 African/African-American data set, and homogeneous African and European reference panels from 1000 Genomes. We adopt the following model:
where
S is the set of SNPs
K are ancestries
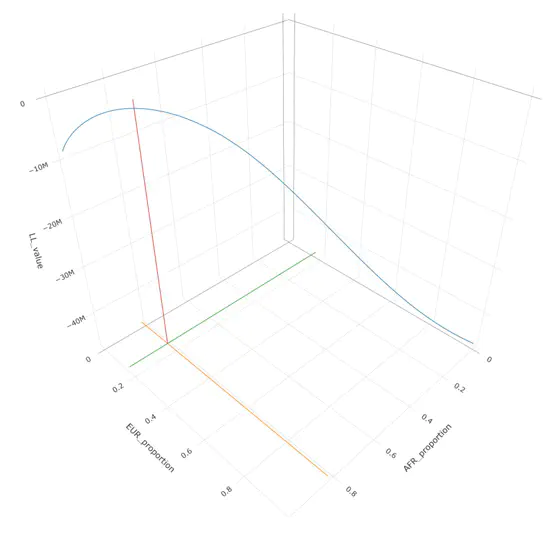
This leads to the above image which shows a maximation of the log likelihood at the following values:
AFR: 0.8277273 EUR: 0.1722727
These values are consistent with known admixture within the gnomAD sample, and are confirmed with other estimation methods (Summix, ADMIXTURE). There are several ways to maximize the log-likelihood including grid-search and Expecation-Maximization algorithms. The binomial distribution can also be inverted and solved using gradient descent methods, such as Sequential Quadratic Programming.
Ian Arriaga-MacKenzie
Statistics and Computational Mathematics
My interests include optimization, algorithm design, and efficient experiment implementation.